Master the Crypto Price Chart Today Before Your Next Trade
- Oct 26, 2025
- 9 min read

Ever stared at a crypto chart and thought, “What on earth am I looking at?” You’re not alone, those lines, candles, and patterns can look more like abstract art than financial data.
A crypto price chart is a visual tool that shows how a cryptocurrency’s value changes over time, helping traders and investors analyze trends and market behavior.
In a market as volatile as crypto, charts aren’t just for day traders, they’re essential for anyone who wants to understand price action instead of guessing. Learning how to read them can turn confusion into clarity and give you an edge in timing your moves.
What You Will Learn in This Article
Why Learning a Crypto Price Chart Can Change How You Trade
At first glance, a crypto price chart might look like a jumble of lines and candles, but beneath that clutter lies a story about the market’s mood.
Charts don’t just tell you what Bitcoin or Ethereum is worth at the moment, they reveal how that price has been moving.

For traders and even casual holders, this is critical because timing matters. Buying too early or selling too late can mean the difference between profit and frustration.
How Crypto Charts Reveal the Market’s Mood
A chart also gives you a direct view of market sentiment. When prices rise steadily, it reflects growing optimism; when they tumble, it signals fear.
Instead of relying on guesswork or hype from social media, a cryptocurrency price chart offers evidence you can actually measure.
Crypto Moves Fast, Here’s Why Charts Keep You Grounded
And let’s be honest: crypto is one of the most volatile markets out there. Moves of 10% or more in a single day aren’t unusual.
Without reading charts, you’re essentially flying blind. With them, you’re equipping yourself with the tools to make smarter, data-driven choices, whether you’re holding for months or just trading a quick swing.
Crypto Price Charts Every Beginner Should Know
Not all charts are created equal, and depending on what you’re looking for, you’ll use different types.
The most basic is the line chart, which simply connects closing prices over a given period. It’s clean, easy to read, and great for spotting general trends, but it lacks detail.

Candlestick Charts: The Most Powerful Tool in Crypto Trading
Then comes the candlestick chart, the favorite of most crypto traders. Each candle shows four key points: the opening price, the closing price, the highest point, and the lowest point during a specific timeframe.
It may look complicated at first, but once you understand the anatomy, it’s like switching from black-and-white TV to full HD.
Bar Charts: Why They Matter (Even if Few Traders Use Them)
The bar chart works similarly to candlesticks, displaying open, high, low, and close. However, it’s less common in crypto because candlesticks are more visually intuitive.
Which Crypto Price Chart Is Best for Beginners?
So which should you use? Beginners might start with line charts to get comfortable, but eventually, learning candlesticks is essential.
If you’re serious about understanding a crypto price chart, candlesticks provide the depth and precision you’ll need to make informed decisions.ou’ll need to make informed decisions.
How to Read a Crypto Candlestick (Without Getting Confused)
Now, let’s zoom in on the candlestick chart, since it’s the bread and butter of crypto trading. Each candle has a body and wicks (sometimes called shadows).
The body represents the price difference between the open and close.
A green (or sometimes white) candle means the price went up, while a red (or black) candle means it went down.
The wicks above and below the body mark the highest and lowest points reached during that period.

Walkthrough Example: How One Candle Tells a Full Story
Here’s a simple example: imagine a candle on a one-hour chart that opens at $30,000, dips to $29,800, rises to $30,500, and closes at $30,400.
The body stretches from $30,000 to $30,400, with a lower wick down to $29,800 and an upper wick up to $30,500. That single candle tells the story of buyers winning the battle during that hour.
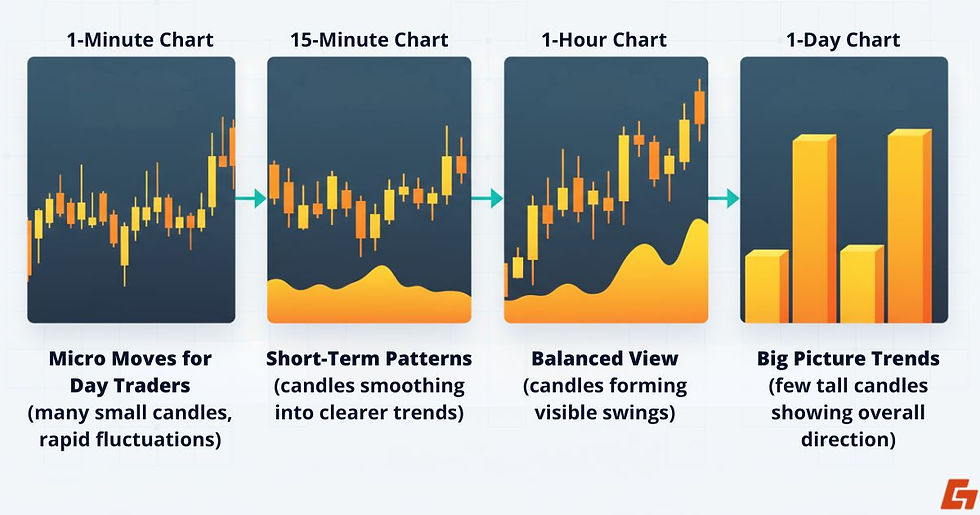
Timeframes Explained: 1-Minute to 1-Day Charts
Timeframes are another piece of the puzzle. You’ll see options like 1-minute, 15-minute, 1-hour, or 1-day charts.
Shorter timeframes reveal micro-movements (great for day traders), while daily candles are better for spotting broader trends.
Why Candlestick Charts Beat Every Other Style
So, when someone says they’re “reading a crypto price chart,” more often than not, they’re really interpreting candlesticks, those small blocks of data that show the push and pull between buyers and sellers.
Crypto Chart Patterns Every Beginner Should Recognize
Once you’ve got the hang of candlesticks, the real magic begins with patterns. A crypto price chart often forms recognizable shapes that hint at what might happen next.
These aren’t guarantees, of course, but traders lean on them because markets have a way of repeating behaviors.
Bullish Patterns: Signals That Buyers Are Taking Over

For bullish signals (when prices may rise), look for patterns like the hammer, which shows sellers pushed the price down but buyers pulled it right back up, suggesting strength.
The engulfing pattern is another favorite, when a big green candle completely engulfs the red one before it, it often signals a shift in momentum.
And then there’s the morning star, a three-candle formation that whispers: “the downtrend might be over.”
Bearish Patterns: Warning Signs of a Market Turn

On the flip side, bearish patterns warn of trouble ahead.
A shooting star appears when the price spikes up but then closes much lower, signaling weakness.
The doji, where opening and closing prices are nearly the same, often marks indecision. Combine it with a strong move before it, and it can point to a reversal.
And of course, the evening star, the bearish cousin of the morning star, suggests buyers are losing steam.
Why Patterns Are Hints, Not Crystal Balls
Patterns don’t work in isolation, though. They’re more like clues, signals that, when paired with volume and indicators, can strengthen your read on the market.
Indicators That Make Crypto Charts Easier
Charts give you the story, but indicators act like subtitles, helping you interpret the plot. If you’re just starting out, a handful of indicators are worth paying attention to.

Volume: The Signal That Confirms Every Move
Volume is the heartbeat of the market. High volume confirms that a move is meaningful; low volume means it might be just noise.
If a cryptocurrency price chart shows a big breakout without much volume, chances are it won’t last long.
Moving Averages: Your Shortcut to Spotting Trends
Moving Averages (MA/EMA) smooth out price action so you can see the overall trend.
A 50-day moving average crossing above the 200-day, for example, is often celebrated as a bullish sign, commonly known as the “golden cross.”
RSI: The Momentum Gauge Traders Swear By
The Relative Strength Index (RSI) acts like a speedometer for momentum. An RSI above 70 suggests the asset is overbought, while below 30 means it may be oversold.
MACD: The Indicator That Spots Reversals Early
The Moving Average Convergence Divergence (MACD) may sound like a mouthful, but it’s powerful.
It tracks momentum and potential reversals through the relationship between two moving averages.
Avoid the Trap: Why Too Many Indicators Backfire
Using too many indicators at once can clutter your chart and your thinking. Start with one or two, practice reading them alongside candlesticks and gradually build confidence.
Indicators are tools, not crystal balls, but they make interpreting a crypto price chart a whole lot clearer.
Support and Resistance: The Secret Levels on Every Crypto Chart
If charts tell a story, support and resistance levels are the plot twists. They’re the invisible barriers that prices bounce off repeatedly, almost like a ball hitting the floor or ceiling.

Support Levels: The Price Floors That Hold the Market Up
Support is the price level where buyers consistently step in, preventing further decline. Imagine Bitcoin dipping to $25,000 multiple times and bouncing back, that’s a support zone.
Resistance Levels: The Ceilings That Stop Prices From Rising
Resistance, on the other hand, is where sellers pile on, stopping the price from climbing higher. If Ethereum keeps stalling near $2,000, that’s resistance at work.
The Psychology of Support and Resistance Traders Can’t Ignore
The beauty of these levels is how psychological they are. Traders around the world are watching them, which makes the effect self-reinforcing.
When you study a crypto price chart, spotting these zones helps you identify where to enter or exit a trade.
Horizontal vs Trendline Support: What’s the Difference?
Support and resistance can be horizontal (flat levels across the chart) or dynamic, shown by trendlines that slope upward or downward.
Mastering them doesn’t just give you insight into the current market, it gives you a roadmap for what could happen next.
Best Tools and Platforms for Reading Crypto Price Charts
Even the best analysis is only as good as the tools behind it. The good news? You don’t need Wall Street software to study a crypto price chart, there are plenty of free and beginner-friendly platforms out there.

TradingView: The Charting Platform Traders Can’t Live Without
This is the go-to platform for most traders. It’s free to start, offers advanced charting features, and lets you customize indicators and patterns.
CoinMarketCap & CoinGecko: Easy Options for Quick Checks
Perfect for quick glances. They won’t overwhelm you with technical tools, but they’re great for checking live prices and simple charts.
Exchange Charts: Handy but Limited Compared to Pro Tools
If you’re already trading on an exchange like Binance, Coinbase Pro, or Kraken, you’ll find built-in charting tools. They’re convenient, though not as flexible as TradingView.
Mobile Charting: How to Track Crypto Anywhere
Many apps now provide responsive, mobile-friendly charting. Handy if you want to track Bitcoin’s moves while waiting in line for coffee.
Consistency Counts: Why You Should Master One Platform
As you progress, you’ll likely gravitate toward one platform that feels comfortable. The key is consistency, stick with one interface long enough to build familiarity with how it presents a cryptocurrency price chart.
Beginner Mistakes With Crypto Charts and How to Avoid Them
Here’s the thing: reading charts isn’t just about knowing what a candlestick means. It’s also about avoiding the traps that beginners (and sometimes even seasoned traders) fall into.

Mistake #1: Using Too Many Indicators
One common pitfall is overcomplicating things with too many indicators. More lines on your chart don’t equal more clarity, they usually just add confusion.
Mistake #2: Ignoring the News Behind the Chart
Another mistake is ignoring fundamentals. A crypto price chart shows market behavior, but it doesn’t explain why an asset is moving. News, regulations, and project updates matter just as much.
Mistake #3: Letting FOMO or Panic Drive Your Trades
Then there’s the emotional side. Fear of missing out (FOMO) or panic-selling can wreck even the best setups. Acting on emotion instead of signals is one of the fastest ways to lose money.
Mistake #4: Trading Without a Strategy or Plan
Finally, trading without a plan, or worse, without backtesting your approach, is like driving without a map.
Keep things simple, stick to a strategy, and remember: the chart is a guide, not a guarantee.
Why Reading a Crypto Price Chart Empowers You
We’ve covered the essentials of reading charts, from candlesticks and patterns to support, resistance, and indicators, giving you a foundation to approach the market with more confidence. A crypto price chart is no longer just a wall of confusing symbols, but a story of buyers, sellers, and shifting sentiment.
The real takeaway? Chart-reading isn’t about predicting the future, it’s about understanding probabilities and making smarter choices in a volatile space.
So here’s the question: will you keep relying on guesswork, or start reading the signals that the market is showing you every day?


Comments